Friday, April 23, 2010

World's Tallest Buildings


The following table lists the tallest buildings in the world by height. The Burj Khalifa, completed in January 2010, tops the list. NOTE: This list includes only buildings.2 For towers, see World's Tallest Towers. See also Skyscraper History, Skyscraper Facts, and America's Favorite Structures.


World's Tallest Buildings
Building, city Year Stories Height
Rank m ft
1. Burj Khalifa (formerly Burj Dubai), Dubai, The United Arab Emirates 2010 160 828 2,716
2. Taipei 101, Taipei, Taiwan 2004 101 508 1,667
3. World Financial Center, Shanghai, China 2008 101 492 1,614
4. Petronas Tower 1, Kuala Lumpur, Malaysia 1998 88 452 1,483
5. Petronas Tower 2, Kuala Lumpur, Malaysia 1998 88 452 1,483
6. Greenland Financial Center, Nanjing, China 2009 66 450 1,476
7. Sears Tower, Chicago 1974 110 442 1,451
8. Guangzhou West Tower, Guangzhou, China 2009 103 438 1,435
9. Jin Mao Building, Shanghai, China 1999 88 421 1,381
10. Two International Finance Centre, Hong Kong 2003 88 415 1,362
11. Trump International Hotel, Chicago, U.S. 2009 96 415 1,362
12. CITIC Plaza, Guangzhou, China 1996 80 391 1,283
13. Shun Hing Square, Shenzhen, China 1996 69 384 1,260
14. Empire State Building, New York 1931 102 381 1,250
15. Central Plaza, Hong Kong 1992 78 374 1,227
16. Bank of China Tower, Hong Kong 1989 70 367 1,205
17. Bank of America Tower, New York City, U.S. 2009 54 366 1,200
18. Almas Tower, Dubai, United Arab Emirates 2009 68 363 1,191
19. Emirates Tower One, Dubai, United Arab Emirates 1999 54 355 1,165
20. Tuntex Sky Tower, Kaohsiung, Taiwan 1997 85 348 1,140
21. Aon Centre, Chicago 1973 80 346 1,136
22. The Center, Hong Kong 1998 73 346 1,135
23. John Hancock Center, Chicago 1969 100 344 1,127
24. Rose Tower, Dubai 2007 72 333 1,093
25. Shimao International Plaza, Shanghai 2006 60 333 1,093
26. Minsheng Bank Building, Wuhan, China 2007 68 331 1,087
27. Ryugyong Hotel, Pyongyang, N. Korea 1995 105 330 1,083
28. China World Trade Center, Beijing, China 2009 74 330 1,083
29. The Index, Dubai, United Arab Emirates 2009 80 328 1,076
30. Q1, Gold Coast, Australia 2005 78 323 1,058
31. Burj al Arab Hotel, Dubai 1999 60 321 1,053
32. Chrysler Building, New York 1930 77 319 1,046
33. Nina Tower I, Hong Kong 2006 80 319 1,046
34. New York Times Building, New York 2007 52 319 1,046
35. Bank of America Plaza, Atlanta 1993 55 317 1,039
36. U.S. Bank Tower, Los Angeles 1990 73 310 1,018
37. Menara Telekom Headquarters, Kuala Lumpur, Malaysia 1999 55 310 1,017
38. Emirates Tower Two, Dubai 2000 56 309 1,014
39. AT&T Corporate Center, Chicago 1989 60 307 1,007
40. The Address Downtown Burj Dubai, Dubai, U.A.E. 2008 63 306 1,004
41. JP Morgan Chase Tower, Houston 1982 75 305 1,002
42. Baiyoke Tower II, Bangkok 1997 85 304 997
43. Two Prudential Plaza, Chicago 1990 64 303 995
44. Wells Fargo Plaza, Houston 1983 71 302 992
45. Kingdom Centre, Riyadh 2002 41 302 992
46. Aspire Tower, Doha 2006 36 300 984
47. Arraya 2, Kuwait City, Kuwait 2009 56 300 984
48. One Island East Centre, Hong Kong, China 2008 69 298 979
49. First Bank Tower, Toronto 1975 72 298 978
50. Shanghai Wheelock Square, Shanghai, China 2009 58 298 978
51. Eureka Tower, Melbourne 2006 91 297 975
52. Comcast Center, Philadelphia, U.S. 2008 57 297 975
53. Landmark Tower, Yokohama, Japan 1993 73 296 971
54. Emirates Crown, Dubai, U.A.E 2008 63 296 971
55. 311 South Wacker Drive, Chicago 1990 65 293 961
56. SEG Plaza, Shenzhen, China 2000 71 292 957
57. American International Building, New York 1932 67 290 952
58. Key Tower, Cleveland 1991 57 289 947
59. Plaza 66, Shanghai 2001 66 288 945
60. One Liberty Place, Philadelphia 1987 61 288 945
61. Columbia Center, Seattle, U.S. 1985 76 285 937
62. Millennium Tower, Dubai 2006 59 285 935
63. Sunjoy Tomorrow Square, Shanghai 2003 55 285 934
64. Chongqing World Trade Center, Chongqing, China 2005 60 283 929
65. Cheung Kong Center, Hong Kong 1999 63 283 929
66. The Trump Building, New York 1930 71 283 927
67. Bank of America Plaza, Dallas 1985 72 281 921
68. United Overseas Bank Plaza, Singapore 1992 66 280 919
69. Republic Plaza, Singapore 1995 66 280 919
70. Overseas Union Bank Centre, Singapore 1986 63 280 919
71. Citigroup Center, New York 1977 59 279 915
72. Hong Kong New World Tower, Shanghai 2002 61 278 913
73. Diwang International Commerce Center, Nanning, China 2006 54 276 906
74. Scotia Plaza, Toronto 1989 68 275 902
75. Williams Tower, Houston 1983 64 275 901
76. Moscow, Moscow 2009 73 274 900
77. Wuhan World Trade Tower, Wuhan, China 1998 60 273 896
78. Cullinan North Tower, Hong Kong 2007 68 270 886
79. Cullinan South Tower, Hong Kong 2007 68 270 886
80. Renaissance Tower, Dallas 1975 56 270 886
81. China International Center Tower B, Guangzhou, China 2007 62 270 884
82. Dapeng International Plaza, Guangzhou, China 2006 56 269 883
83. One Luijiazui, Shanghai, China 2008 47 269 883
84. 21st Century Tower, Dubai 2003 55 269 883
85. Naberezhnaya Tower C, Moscow 2007 61 268 881
86. Al Faisaliah Center, Riyadh 2000 30 267 876
87. 900 North Michigan Ave., Chicago 1989 66 265 871
88. Bank of America Corporate Center, Charlotte 1992 60 265 871
89. SunTrust Plaza, Atlanta 1992 60 265 871
90. Al Kazim Tower 1, Dubai, U.A.E 2008 53 265 871
91. Al Kazim Tower 2, Dubai, U.A.E 2008 53 265 871
92. BOCOM Financial Towers, Shanghai 1999 52 265 869
93. 120 Collins Street, Melbourne 1991 52 265 869
94. Triumph Palace, Moscow 2005 57 264 866
95. Tower Palace Three, Tower G, Seoul 2004 73 264 865
96. Trump World Tower, New York 2001 72 262 861
97. Shenzhen Special Zone Daily Tower, Shenzhen, China 1998 48 262 860
98. Water Tower Place, Chicago 1976 74 262 859
99. Grand Gateway Plaza I, Shanghai 2005 52 262 859
100. Grand Gateway Plaza II, Shanghai 2005 52 262 859
NOTE: When a building is “topped out” (the point of construction when the structure has met its proposed structural top), the building is officially ranked and is placed on the list. UC indicates under construction: although the building has been “topped out,” construction has not been completed. Height is measured from sidewalk level of main entrance to structural top of building. This includes spires, but does not include antennas or flagpoles.
1. The World Trade Center twin towers of New York City ranked fifth and sixth (at 1,368 ft and 1,362 ft) on this list until their destruction on Sept. 11, 2001.
2. A building differs from a tower in that the former is considered to be a structure that is designed for residential, business, or manufacturing purposes. Also, an essential characteristic of a building is that it has floors.

Most Popular Names


Find the most popular baby names given each year to boys and girls in the United States from 1880 to the present. Visit the Interactive Baby Name Finder for more popular baby names.

Boys:

  • 1880: John, William, Charles, George, James, Joseph, Frank, Henry, Thomas, Harry
  • 1890: John, William, James, George, Charles, Joseph, Frank, Harry, Henry, Edward
  • 1900: John, William, James, George, Charles, Joseph, Frank, Henry, Robert, Harry
  • 1910: John, William, James, Robert, Joseph, Charles/George (tie), Edward, Frank, Henry
  • 1920: John, William, James, Robert, Joseph, Charles, George, Edward, Thomas, Frank
  • 1930: Robert, James, John, William, Richard, Charles, Donald, George, Joseph, Edward
  • 1940: James, Robert, John, William, Richard, Charles, David, Thomas, Donald, Ronald
  • 1950: John, James, Robert, William, Michael, David, Richard, Thomas, Charles, Gary
  • 1960: David, Michael, John, James, Robert, Mark, William, Richard, Thomas, Steven
  • 1970: Michael, David, John, James, Robert, Christopher, William, Mark, Richard, Brian
  • 1980: Michael, Jason, Christopher, David, James, Matthew, John, Joshua, Robert, Daniel
  • 1990: Michael, Christopher, Joshua, Matthew, David, Daniel, Andrew, Joseph, Justin, James
  • 2000: Jacob, Michael, Matthew, Joshua, Christopher, Nicholas, Andrew, Joseph, Daniel, Tyler
  • 2002: Jacob, Michael, Joshua, Matthew, Ethan, Joseph, Andrew, Christopher, Daniel, Nicholas
  • 2003: Jacob, Michael, Joshua, Matthew, Andrew, Joseph, Ethan, Daniel, Christopher, Anthony
  • 2004: Jacob, Michael, Joshua, Matthew, Ethan, Andrew, Daniel, William, Joseph, Christopher
  • 2005: Jacob, Michael, Joshua, Matthew, Ethan, Andrew, Daniel, Anthony, Christopher, Joseph
  • 2006: Jacob, Michael, Joshua, Ethan, Matthew, Daniel, Christopher, Andrew, Anthony, William
  • 2007: Jacob, Michael, Ethan, Joshua, Daniel, Christopher, Anthony, William, Matthew, Andrew
  • 2008: Jacob, Michael, Ethan, Joshua, Daniel, Alexander, Anthony, William, Christopher, Matthew

Girls

  • 1880: Mary, Anna, Elizabeth, Margaret, Minnie, Emma, Martha, Alice, Marie, Annie/Sarah (tie)
  • 1890: Mary, Anna, Elizabeth, Emma, Margaret, Rose, Ethel, Florence, Ida, Bertha/Helen (tie)
  • 1900: Mary, Helen, Anna, Margaret, Ruth, Elizabeth, Marie, Rose, Florence, Bertha
  • 1910: Mary, Helen, Margaret, Dorothy, Ruth, Anna, Mildred, Elizabeth, Alice, Ethel
  • 1920: Mary, Dorothy, Helen, Margaret, Ruth, Virginia, Elizabeth, Anna, Mildred, Betty
  • 1930: Mary, Betty, Dorothy, Helen, Barbara, Margaret, Maria, Patricia, Doris, Joan/Ruth (tie)
  • 1940: Mary, Barbara, Patricia, Carol, Judith, Betty, Nancy, Maria, Margaret, Linda
  • 1950: Linda, Mary, Patricia, Barbara, Susan, Maria, Sandra, Nancy, Deborah, Kathleen
  • 1960: Mary, Susan, Maria, Karen, Lisa, Linda, Donna, Patricia, Debra, Deborah
  • 1970: Jennifer, Lisa, Kimberly, Michelle, Angela, Maria, Amy, Melissa, Mary, Tracy
  • 1980: Jennifer, Jessica, Amanda, Melissa, Sarah, Nicole, Heather, Amy, Michelle, Elizabeth
  • 1990: Jessica, Ashley, Brittany, Amanda, Stephanie, Jennifer, Samantha, Sarah, Megan, Lauren
  • 2000: Emily, Hannah, Madison, Ashley, Sarah, Alexis, Samantha, Jessica, Taylor, Elizabeth
  • 2002: Emily, Madison, Hannah, Emma, Alexis, Ashley, Abigail, Sarah, Samantha, Olivia
  • 2003: Emily, Emma, Madison, Hannah, Olivia, Abigail, Alexis, Ashley, Elizabeth, Samantha
  • 2004: Emily, Emma, Madison, Olivia, Hannah, Abigail, Isabella, Ashley, Samantha, Elizabeth
  • 2005: Emily, Emma, Madison, Abigail, Olivia, Isabella, Hannah, Samantha, Ava, Ashley
  • 2006: Emily, Emma, Madison, Isabella, Ava, Abigail, Olivia, Hannah, Sophia, Samantha
  • 2007: Emily, Isabella, Emma, Ava, Madison, Sophia, Olivia, Abigail, Hannah, Elizabeth
  • 2008: Emma, Isabella, Emily, Madison, Ava, Olivia, Sophia, Abigail, Elizabeth, Chloe

Economic Statistics

Economic Statistics by Country, 2005


Country GDP/PPP GDP/PPP
per
capita
Real
growth
rate
(%)
Inflation
(%)
Afghanistan $21.5 billion1 $8001 8.0% 16.31%
Albania 18.97 billion 4,900 5.5 2.4
Algeria 233.2 billion 7,200 6.0 4.7
Andorra 1.84 billion1 24,0001 4.01 3.41
Angola 45.93 billion 3,200 19.1 17.7
Antigua and Barbuda 750 million2 11,0002 3.02 0.43
Argentina 518.1 billion 13,100 8.7 12.3
Armenia 13.46 billion 4,500 13.9 –0.2
Australia 640.1 billion 31,900 2.5 2.7
Austria 267.6 billion 32,700 1.9 2.3
Azerbaijan 37.92 billion 4,800 26.4 12.0
Bahamas 6.098 billion 20,200 3.5 1.21
Bahrain 15.83 billion 23,000 5.9 2.7
Bangladesh 304.3 billion 2,100 5.7 6.7
Barbados 4.745 billion 17,000 4.1 –0.54
Belarus 70.68 billion 6,900 8.0 8.0
Belgium 325 billion 31,400 1.5 2.7
Belize 1.778 billion1 6,800 3.8 3.0
Benin 8.553 billion 1,100 3.5 3.2
Bhutan 2.9 billion4 1,4004 5.34 3.02
Bolivia 25.95 billion 2,900 4.0 4.9
Bosnia and Herzegovina 22.89 billion 6,800 5.3 1.4
Botswana 17.24 billion 10,500 4.5 8.3
Brazil 1.556 trillion 8,400 2.4 5.7
Brunei 6.842 billion4 23,6004 1.71 0.91
Bulgaria 71.54 billion 9,600 5.5 4.5
Burkina Faso 16.95 billion 1,300 4.5 3.0
Burundi 5.654 billion 700 1.1 14.0
Cambodia 30.65 billion 2,200 6.0 4.3
Cameroon 40.83 billion 2,400 2.8 1.5
Canada 1.114 trillion 34,000 2.9 2.2
Cape Verde 2.99 billion 6,200 5.5 1.8
Central African Republic 4.784 billion 1,100 2.2 3.65
Chad 14.79 billion 1,500 6.0 5.5
Chile 187.1 billion 11,300 6.0 3.2
China 8.859 trillion 6,800 9.9 1.9
Colombia 337.5 billion 7,900 5.1 4.9
Comoros 441 million2 600 3.0 3.0
Congo, Dem. Rep. of 40.67 billion 700 6.5 9.01
Congo, Rep. of 4.631 billion 1,300 8.0 2.0
Costa Rica $44.68 billion $11,100 4.0% 13.8%
Côte d'Ivoire 28.52 billion 1,600 1.0 2.0
Croatia 55.76 billion 11,600 4.0 3.2
Cuba 39.17 billion 3,500 8.0 4.2
Cyprus* 16.85 billion 21,600 3.7 2.5

4.54 billion 7,1351 10.6 9.11
Czech Republic 199.4 billion 19,500 6.0 2.0
Denmark 188.1 billion 34,600 3.4 1.9
Djibouti 619 million2 1,3002 3.52 2.02
Dominica 384 million4 5,5004 –1.04 1.05
Dominican Republic 63.73 billion 7,000 9.3 4.3
East Timor 370 million1 4001 1.01 1.81
Ecuador 56.9 billion 4,300 3.9 3.1
Egypt 303.5 billion 3,900 4.9 4.3
El Salvador 31.24 billion 4,700 2.8 4.7
Equatorial Guinea 25.69 billion 50,200 18.6 5.0
Eritrea 4.471 billion 1,000 2.0 15.0
Estonia 22.29 billion 16,700 9.6 4.0
Ethiopia 62.88 billion 900 8.9 6.0
Fiji 5.38 billion 6,000 1.7 1.62
Finland 161.5 billion 30,900 2.2 1.2
France 1.816 trillion 29,900 1.4 1.9
Gabon 9.535 billion 6,800 2.1 1.5
Gambia 3.024 billion 1,900 5.5 8.8
Georgia 15.56 billion 3,300 7.0 8.0
Germany 2.504 trillion 30,400 0.9 2.0
Ghana 54.45 billion 2,500 4.3 15.0
Greece 236.8 billion 22,200 3.7 3.8
Grenada 440 million2 5,0002 2.52 2.85
Guatemala 56.86 billion 4,700 3.2 9.1
Guinea 18.99 billion 2,000 2.0 25.0
Guinea-Bissau 1.185 billion 800 2.3 4.02
Guyana 3.549 billion 4,600 –2.5 5.5
Haiti 14.15 billion 1,700 2.0 15.2
Honduras 20.59 billion 2,900 4.2 9.2
Hungary 162.6 billion 16,300 4.1 3.7
Iceland 10.57 billion 35,600 5.7 4.1
India 3.611 trillion 3,300 7.6 4.6
Indonesia 865.6 billion 3,600 5.6 10.4
Iran 561.6 billion 8,300 6.1 16.0
Iraq 94.1 billion 3,400 –3.0 40.0
Ireland $164.6 billion $41,000 4.7% 2.7%
Israel 154.5 billion 24,600 5.2 1.3
Italy 1.698 trillion 29,200 0.1 1.9
Jamaica 12.17 billion 4,400 1.5 12.9
Japan 4.018 trillion 31,500 2.7 –0.2
Jordan 26.8 billion 4,700 6.1 5.0
Kazakhstan 124.3 billion 8,200 9.2 7.4
Kenya 37.15 billion 1,100 5.2 12.0
Kiribati 79 million 8005 1.55 2.55
Korea, North 40 billion 1,700 1.0 n.a.
Korea, South 965.3 billion 20,400 3.9 2.6
Kuwait 44.77 billion 19,200 4.8 3.5
Kyrgyzstan 10.65 billion 2,100 2.0 4.2
Laos 12.13 billion 1,900 7.2 10.0
Latvia 30.29 billion 13,200 10.2 5.9
Lebanon 23.69 billion 6,200 0.5 2.4
Lesotho 5.124 billion 2,500 0.8 4.7
Liberia 2.755 billion 1,000 8.0 15.04
Libya 65.79 billion 11,400 8.5 –1.0
Liechtenstein 1.786 billion6 25,0006 11.06 1.05
Lithuania 49.21 billion 13,700 7.5 2.6
Luxembourg 30.74 billion 55,600 3.7 3.6
Macedonia 16.03 billion 7,800 3.7 0.5
Madagascar 16.36 billion 900 5.1 10.0
Malawi 7.524 billion 600 –3.0 15.4
Malaysia 290.2 billion 12,100 5.3 2.9
Maldives 1.25 billion2 3,9002 –5.5 5.6
Mali 13.56 billion 1,200 6.0 4.52
Malta 7.926 billion 19,900 1.0 2.8
Marshall Islands 115 million5 2,3005 1.05 1.85
Mauritania 6.891 billion 2,200 5.5 7.04
Mauritius 16.09 billion 13,100 3.0 5.6
Mexico 1.067 trillion 10,000 3.0 3.3
Micronesia 277 million 3,9002 1.02 2.02
Moldova 8.175 billion 1,800 7.1 12.0
Monaco 870 million 27,0003 0.93 1.93
Mongolia 5.242 billion 1,900 6.2 9.5
Montenegro 2.412 billion 3,800 n.a. 3.41
Morocco 138.3 billion 4,200 1.8 2.1
Mozambique 26.03 billion 1,300 7.0 7.8
Myanmar (Burma) 78.74 billion 1,700 2.9 25.0
Namibia 14.23 billion 7,000 3.5 2.7
Nauru 60 million 5,000 n.a. –3.67
Nepal 39.9 billion 1,400 2.7 7.8
Netherlands 499.8 billion 30,500 1.1 1.7
New Zealand 101.8 billion 25,200 2.2 3.0
Nicaragua 16.09 billion 2,900 4.0 9.6
Niger 11.28 billion 900 4.5 0.21
Nigeria 174.1 billion 1,400 6.2 15.6
Norway 194.1 billion 42,300 3.9 2.1
Oman 39.65 billion 13,200 4.3 0.4
Pakistan 393.4 billion 2,400 6.9 9.2
Palau 174 million5 5,8005 1.05 3.43
Panama 22.76 billion 7,200 6.4 2.5
Papua New Guinea 14.37 billion 2,600 2.9 1.7
Paraguay 29.08 billion 4,900 2.7 7.5
Peru 164.5 billion 5,900 6.7 1.6
Philippines 451.3 billion 5,100 5.1 7.9
Poland 514 billion 13,300 3.2 2.1
Portugal 204.4 billion 19,300 0.3 2.4
Qatar $23.64 billion $27,400 8.8% 7.8%
Romania 183.6 billion 8,200 4.5 8.6
Russia 1.589 trillion 11,100 6.4 11.0
Rwanda 12.65 billion 1,500 5.2 8.0
St. Kitts and Nevis 339 million2 8,8002 –1.92 1.75
St. Lucia 866 million2 5,4002 3.32 3.05
St. Vincent and the Grenadines 342 million2 2,9002 0.72 –0.45
Samoa 1 billion2 5,6002 5.02 4.05
San Marino 940 million5 34,6005 7.55 3.35
São Tomé and Príncipe 214 million4 1,2004 6.01 15.1
Saudi Arabia 338 billion 12,800 6.1 0.4
Senegal 20.53 billion 1,800 6.1 1.7
Serbia and Montenegro 41.15 billion8 4,4008 5.99 15.5
Seychelles 626 million2 7,8002 –3.0 4.4
Sierra Leone 4.921 billion 800 6.3 1.02
Singapore 124.3 billion 28,100 6.4 1.0
Slovakia 87.32 billion 16,100 5.5 2.7
Slovenia 43.36 billion 21,600 3.9 2.4
Solomon Islands 800 million2 1,700 2 5.84 10.04
Somalia 4.809 billion 600 2.4 n.a.
South Africa 533.2 billion 12,000 4.9 4.6
Spain 1.029 trillion 25,500 3.4 3.4
Sri Lanka 85.34 billion 4,300 5.6 11.2
Sudan 85.65 billion 2,100 7.0 11.0
Suriname 2.818 billion 4,100 2.0 9.5
Swaziland 5.658 billion 5,000 1.8 4.0
Sweden 268 billion 29,800 2.7 0.5
Switzerland 241.8 billion 32,300 1.8 1.2
Syria 72.33 billion 3,900 4.5 2.6
Taiwan 631.2 billion 27,600 3.8 2.3
Tajikistan 8.73 billion 1,200 8.0 8.0
Tanzania 27.07 billion 700 0.0 4.0
Thailand 560.7 billion 8,300 4.5 4.8
Togo 8.965 billion 1,700 1.0 5.5
Tonga 244 million2 2,3002 1.410 10.32
Trinidad and Tobago 18.01 billion 16,700 7.0 6.8
Tunisia 83.54 billion 8,300 4.3 3.2
Turkey 572 billion 8,200 5.6 7.7
Turkmenistan 39.54 billion 8,000 4.0 10.0
Tuvalu 12.2 million3 1,1003 3.03 5.03
Uganda 48.73 billion 1,800 4.0 9.7
Ukraine 340.4 billion 7,200 2.4 10.3
United Arab Emirates 111.3 billion 43,400 6.7 4.5
United Kingdom 1.83 trillion 30,300 1.8 2.2
United States 12.36 trillion 41,800 3.5 3.2
Uruguay 32.96 billion 9,600 6.5 4.9
Uzbekistan 48.24 billion 1,800 7.2 8.8
Vanuatu 580 million4 2,9004 1.14 3.14
Venezuela 153.7 billion 6,100 9.3 15.7
Vietnam 232.2 billion 2,800 8.4 8.4
Yemen 19.37 billion 900 2.4 9.6
Zambia 10.59 billion 900 5.1 19.0
Zimbabwe 28.37 billion 2,300 –7.0 585.0
NOTES: Definitions: Gross domestic product (GDP): The value of all goods and services produced domestically. Purchasing power parity (PPP): The PPP method involves the use of standardized international dollar price weights, which are applied to the GDP produced in a given economy. The data derived from the 1998 method provide a better comparison of economic well-being between countries than conversions at official currency exchange rates. n.a. = not available. *First line of figures for Greek Cyprus, second for Turkish Cyprus.
1. 2004 est.
2. 2002 est.
3. 2000 est.
4. 2003 est.
5. 2001 est.
6. 1999 est.
7. 1993 est.
8. Including Kosovo.
9. Excluding Kosovo.
10. FY03/04 est.
Source: The World Factbook, 2006.

World's 50 Most Populous Countries

World's 50 Most Populous Countries:

This table provides figures about the 50 most populous nations on Earth, from China to Romania.

Rank Country Population
1. China 1,321,851,888
2. India 1,129,866,154
3. United States 301,139,947
4. Indonesia 234,693,997
5. Brazil 190,010,647
6. Pakistan 169,270,617
7. Bangladesh 150,448,339
8. Russia 141,377,752
9. Nigeria 135,031,164
10. Japan 127,467,972
11. Mexico 108,700,891
12. Philippines 91,077,287
13. Vietnam 85,262,356
14. Germany 82,400,996
15. Egypt 80,264,543
16. Ethiopia 76,511,887
17. Turkey 71,158,647
18. Iran 65,397,521
19. Thailand 65,068,149
20. Congo, Dem. Rep. 64,606,759
21. France 61,083,916
22. United Kingdom 60,776,238
23. Italy 58,147,733
24. Korea, South 49,044,790
25. Myanmar
(Burma)
47,373,958
26. Ukraine 46,299,862
27. Colombia 44,227,550
28. South Africa 43,997,828
29. Sudan 42,292,929
30. Spain 40,448,191
31. Argentina 40,301,927
32. Poland 38,518,241
33. Tanzania 38,139,640
34. Kenya 36,913,721
35. Morocco 33,757,175
36. Canada 33,390,141
37. Algeria 33,333,216
38. Afghanistan 31,889,923
39. Uganda 30,262,610
40. Nepal 28,901,790
41. Peru 28,674,757
42. Uzbekistan 27,780,059
43. Saudi Arabia 27,601,038
44. Iraq 27,499,638
45. Venezuela 26,084,662
46. Malaysia 24,821,286
47. Korea, North 23,301,725
48. Taiwan 23,174,294
49. Ghana 22,931,299
50. Romania 22,276,056

Wednesday, March 31, 2010

Amazing Information

Indian Twin Village


Baffled doctors are trying to unravel the mystery of an Indian village boasting more than 220 sets of twins born to just 2,000 families.

Experts who have visited the remote tropical village of Kodinhi, in Kerala, have been left scratching their heads over the phenomenon that has seen almost six times as many twins born than the global average.

In 2008 alone 15 pairs of twins were born in the village out of 300 healthy deliveries and this year is expected to top that number.


World's Oldest Mother


A 67-year-old Romanian has become the oldest woman to give birth, fuelling an ethical, medical and religious debate about fertility treatment.

Adriana Iliescu gave birth to a daughter who weighed 1.4 kilograms and was delivered by caesarean section after a twin embryo died in the womb.

Sunday's birth came six weeks before the university professor was due to have the child. She started fertility treatment at the age of 58.


Mrs Iliescu finally conceived last May, but she and her doctors kept the news secret until she gave an interview to a Romanian TV station in December announcing she was pregnant with twin girls. The revelation prompted outrage in some quarters and celebration in others.

The mother-to-be made an emotional defence. While critics complained she would be too old to watch her children grow up, she insisted that her family had a history of longevity.


At her Bucharest hospital, doctors said the surviving infant was in intensive care but breathing independently. "The mother is doing well," a spokesman said. "She is saying she has been given a new lease of life."

The Romanian Orthodox Church gave the birth its blessing, but some doctors have been outraged. The head of Romania's medical ethics board said such a controversial procedure should have been debated before conception.

The previous oldest woman to give birth had a son 10 years ago when she was 62.


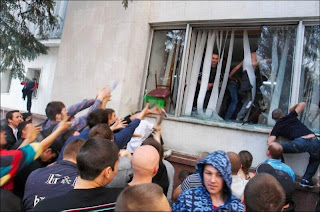
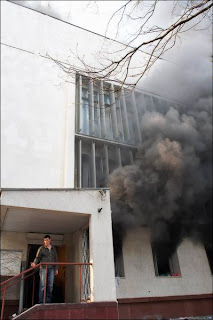
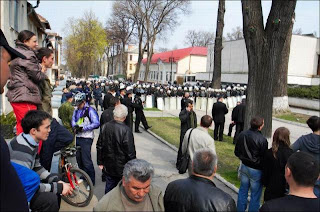
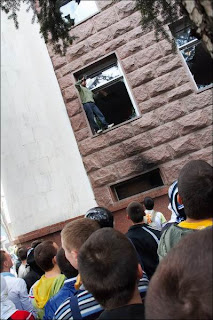
198 Best Photos of Events in Kishinev, Moldova


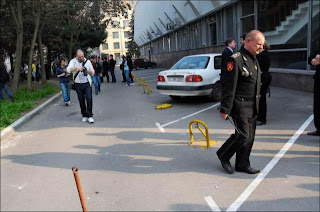
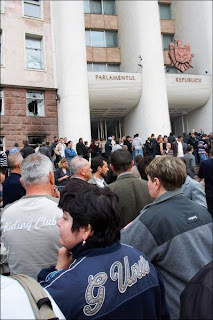
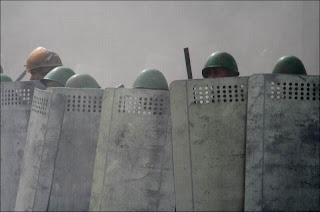
MOSCOW, April 8 - RIA Novosti. Law enforcement agencies of Moldova stated that control of the situation in Chisinau, where the eve of the protests against the outcome of the parliamentary opposition elections resulted in massive street riots. The crowd defeated the residence of the president and the parliament building, overturned cars, cast stone the police.

President Vladimir Voronin called the attempt to seize power by what is happening and promised to protect the country from pogromschikov and putschists. According to him, all the observers have been April 5 parliamentary elections in Moldova said that the elections were free of violations, so there is no reason to organize such protests.